Here I am going to share tips to make a simple chart in Excel.
Open Microsoft Excel-
Start>All Programs>Microsoft Office>Microsoft Office Excel
You will find a excel blank excel sheet.
Following tips to create excel chart.
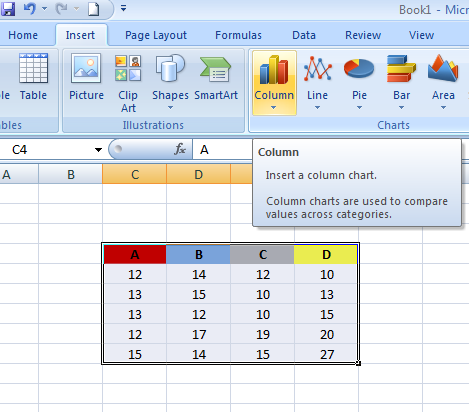
1- First of all you have to make data table.Like below I have created.

You can make good format either you can create you self
as your requirement.And select this table.

2- After that Insert Tab on Menu Bar which situates beside
Home tab.See below picture.

Now you will see charts section and some charts type.
Column chart appears first.
Click on column chart type there will be types in it you will see
Now whatever chart you required select it.
Like I have selected 2D-Clustered Column


3- Now beautiful chart will appear in sheet,you can drag and drop
it where you want to put it.

Now I can say you have done awesome job.
Watch video to create column chart.
Open Microsoft Excel-
Start>All Programs>Microsoft Office>Microsoft Office Excel
You will find a excel blank excel sheet.
Following tips to create excel chart.
1- First of all you have to make data table.Like below I have created.

You can make good format either you can create you self
as your requirement.And select this table.

2- After that Insert Tab on Menu Bar which situates beside
Home tab.See below picture.

Now you will see charts section and some charts type.
Column chart appears first.
Click on column chart type there will be types in it you will see
Now whatever chart you required select it.
Like I have selected 2D-Clustered Column

3- Now beautiful chart will appear in sheet,you can drag and drop
it where you want to put it.

Watch video to create column chart.
It is much better way to visualization of data in charts because it helps to
understand easily. You can make awesome thing with the use of charts there are various type column charts.
You can try other type and make more attractive charts. I hope this tutorial will help you to create awesome charts to represent data better
No comments:
Post a Comment