Tuesday 21 July 2015

How to Create 2D Stacked Column Chart in Excel

Stacked Column charts are very useful to create chart to compare data with use of vertical rectangles of all data of a category to other categories.
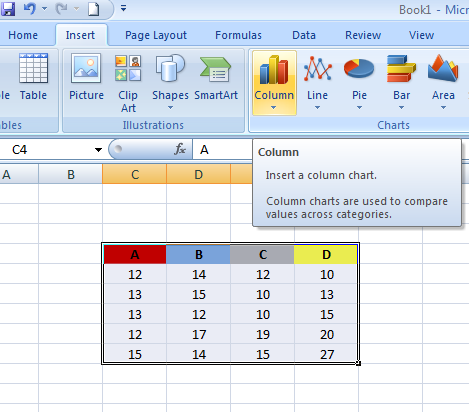
First off all we have to create a simple data table like below I have created.


After this next step select this data table. There are 2 simple way to select table.
I)          Click on first cell and move forward with arrow key to last cell in data table with shift key. After this with shift key and down key go down.
II)        Either you can use mouse to select whole data table


Next step you have to do. Go menu tab and click on insert option you will see column option, click on it.


A drop down option type menu will appear where you will see 2D Column options first.
In 2D Column second option from left is stacked column. 


Click on it
Now Stacked Column chart has been created.


Watch tutorial to create 2D Stacked Column Chart in Excel


Friday 10 July 2015

How to Make a Simple Chart in Excel

Here I am going to share tips to make a simple chart in Excel.

Open Microsoft Excel-

Start>All Programs>Microsoft Office>Microsoft Office Excel

You will find a excel blank excel sheet.

Following tips to create excel chart.

1- First of all you have to make data table.Like below I have created.


You can make good format either you can create you self
as your requirement.And select this table.


2-   After that Insert Tab on Menu Bar which situates beside
      Home tab.See below picture.


Now you will see charts section and some charts type.
 Column chart appears first.

 Click on column chart type there will be types in it you will see
 Now whatever chart you required select it.
  Like I have selected 2D-Clustered Column


3-  Now beautiful chart will appear in sheet,you can drag and drop
      it where you want to put it.


Now I can say you have done awesome job.

Watch video to create column chart.


It is much better way to visualization of data in charts because it helps to 
understand easily. You can make awesome thing with the use of charts there are various type column charts.
You can try other type and make more attractive charts. I hope this tutorial will help you to create awesome charts to represent data better


Related Posts Plugin for WordPress, Blogger...